Abstract
Spiking is a critical determinant of success in volleyball, serving as a primary offensive strategy to score points and maintain momentum. This study analyzed the spiking performance of the champion and runner-up teams in the 2024 Volleyball Nations League (VNL), focusing on five spiking types: line, cross, sharp, tool, and tip. A total of 2,599 spiking actions were analyzed using Focus X2, a video analysis tool. The results revealed significant differences in spiking patterns. The runner-up team relied more heavily on cross spikes (M = 12.91, p < 0.01) and tip spikes (M = 6.50, p < 0.01), while the champion team demonstrated a balanced approach. The champion team achieved higher attack efficiency (M = 13.48, SD = 2.40) compared to the runner-up team (M = 14.88, SD = 3.23, p = 0.01). Additionally, the runner-up team exhibited higher frequencies of cross spikes (31.44%) and tip spikes (18.39%), but the champion team's superior consistency in rally play (M = 11.48, SD = 4.91 vs. M = 17.63, SD = 5.70, p < 0.01) and lower error rates (M = 3.73, SD = 2.00 vs. M = 4.05, SD = 1.99, p = 0.40) contributed to their success. The findings highlight the importance of balancing tactical diversity and technical precision in spiking. This research underscores the value of performance analysis in enhancing volleyball training and match strategies, offering actionable insights for coaches, players, and analysts. The study’s implications extend beyond immediate match outcomes, offering a framework for evidence-based training and strategic development in volleyball.
Keywords
Performance Analysis, Volleyball Spiking, Scoring, Indicator, VNL2024
1. Introduction
Volleyball is a sport where offensive capabilities hold critical importance in determining match outcomes. Among the various skills, spiking is considered the most decisive offensive action, as it directly contributes to a team’s ability to score points. The execution of a successful spike reflects not only technical excellence but also strategic adaptability, requiring players to exploit weaknesses in their opponents’ defensive setup
| [1] | Drikos S, Tsoukos A. Data benchmarking through a longitudinal study in high-level men’s volleyball. International Journal of Performance Analysis in Sport. 2018; 18(4): 470-80. h ttps://doi.org/10.1080/24748668.2018.1493319 |
[1]
. The complexity of spiking, involving precision, timing, and power, makes it a vital area of focus in volleyball performance analysis, particularly at elite levels of competition. Despite extensive research on spiking techniques, there is a lack of comprehensive analysis on how different spiking strategies influence match outcomes in elite-level competitions such as the Volleyball Nations League (VNL). This study aims to fill this gap by analyzing the spiking performance of the champion and runner-up teams in the 2024 VNL, focusing on five spiking types: line, cross, sharp, tool, and tip. By leveraging advanced video analysis tools like Focus X2, this research provides a detailed evaluation of spiking performance, offering valuable insights for coaches, players, and analysts. The significance of spiking lies in its dual role as both a scoring tool and a means to maintain offensive momentum. Research has shown that successful spikes are associated with key performance indicators such as attack efficiency, error minimization, and tactical diversity
| [2] | Reynaud C. The volleyball coaching bible / American Volleyball Coaches Administration. Champaign (IL): Human Kinetics; 2015. |
[2]
. Effective spiking can disrupt well-organized defensive systems and create opportunities for extended rallies, ultimately increasing a team’s chances of securing victory
| [3] | Rangubhet KR, Chailert P, U-siri P. Effect of volleyball scoring performance analysis on the Women's VNL 2021 championship team. 2023 Joint International Conference on Digital Arts, Media and Technology with ECTI Northern Section Conference on Electrical, Electronics, Computer and Telecommunications Engineering (ECTI DAMT & NCON). 2023; 498-501. https://doi.org/10.1109/ECTIDAMTNCON57770.2023.10139760 |
[3]
. In this context, analyzing spiking patterns and outcomes provides valuable insights into how teams can optimize their offensive strategies and adapt their gameplay to counteract opposing defenses.
Performance analysis in volleyball has become a cornerstone of modern sports science. It allows researchers and coaches to systematically evaluate technical and tactical aspects of gameplay, offering data-driven insights into player performance and team strategies
| [4] | Sousa M, Castro J, Marcelino R. Relationship between the opponent block and the hitter in elite male volleyball. J Quant Anal Sports. 2010; 6(3): 1-13. https://doi.org/10.2202/1559-0410.1216 |
[4]
. The advent of advanced tools such as Focus X2 has revolutionized the way data is collected and analyzed. This software facilitates precise video segmentation, categorization of actions, and statistical evaluation, enabling a deeper understanding of the game. By providing reliable and detailed data on spiking actions, Focus X2 enhances the accuracy of performance evaluations and supports the development of evidence-based training programs
| [5] | Santi K, Rangubhet KR. Attack performance model analysis: Outside spiker of the champion women's team in Volleyball Nations League 2022. 2023 Joint International Conference on Digital Arts, Media and Technology with ECTI Northern Section Conference on Electrical, Electronics, Computer and Telecommunications Engineering (ECTI DAMT & NCON). 2023; 506-510. https://doi.org/10.1109/ECTIDAMTNCON57770.2023.10139769 |
[5]
. The use of video analysis tools like Focus X2 is particularly relevant in high-stakes competitions such as the Volleyball Nations League (VNL). As a premier international tournament, the VNL features the world’s best teams competing at the highest level, making it an ideal platform for performance analysis. Studies on spiking performance in the VNL have highlighted the importance of understanding offensive patterns, as these directly influence match outcomes
| [6] | Luangtrongkit, S., Kongtongkum, P., Rangubhet, K. R. Offensive Patterns Analysis of Thai Nation Team in Volleyball Women’s Nations League 2022. American Journal of Sports Science. 2024; 12(2), 12-19. https://doi.org/10.11648/j.ajss.20241202.11 |
[6]
. For instance, the ability to execute cross-court spikes effectively or utilize tip shots strategically can be the difference between winning and losing in closely contested matches.
A key aspect of performance analysis is the comparison of spiking capabilities between teams. Such comparisons provide insights into what differentiates elite performers from their competitors. For example, studies by Rangubhet et al.
have shown that champion teams often display a balanced use of spiking techniques, combining power, precision, and tactical variety to outmaneuver their opponents. This balance is contrasted with the tendencies of runner-up teams, which may rely more heavily on specific spiking types, such as cross-court attacks, to compensate for deficiencies in other areas
| [3] | Rangubhet KR, Chailert P, U-siri P. Effect of volleyball scoring performance analysis on the Women's VNL 2021 championship team. 2023 Joint International Conference on Digital Arts, Media and Technology with ECTI Northern Section Conference on Electrical, Electronics, Computer and Telecommunications Engineering (ECTI DAMT & NCON). 2023; 498-501. https://doi.org/10.1109/ECTIDAMTNCON57770.2023.10139760 |
[3]
. Understanding these differences is crucial for designing training programs that replicate successful strategies or address identified weaknesses.
The analysis of spiking performance also extends to individual players. The role of outside hitters, who often execute the majority of spikes in a match, has been extensively studied in recent years. Research by Santi et al.
| [5] | Santi K, Rangubhet KR. Attack performance model analysis: Outside spiker of the champion women's team in Volleyball Nations League 2022. 2023 Joint International Conference on Digital Arts, Media and Technology with ECTI Northern Section Conference on Electrical, Electronics, Computer and Telecommunications Engineering (ECTI DAMT & NCON). 2023; 506-510. https://doi.org/10.1109/ECTIDAMTNCON57770.2023.10139769 |
[5]
emphasized the importance of technical consistency and tactical decision-making in the success of outside hitters, particularly in executing tool spikes and sharp-angle attacks. These findings underscore the need for tailored training approaches that focus on developing specific skills required for each position. The application of performance analysis in volleyball is not limited to match evaluation; it also plays a significant role in training and player development. By identifying key performance indicators, such as attack efficiency and error rates, coaches can design targeted drills to address specific areas of improvement. For instance, if a team struggles with tool spikes, training sessions can focus on improving players’ ability to use blockers as tools for scoring. Similarly, if a team excels in cross-court spikes, coaches can develop strategies to maximize the effectiveness of this strength while preparing countermeasures against opponents who may adopt similar tactics.
Another critical aspect of performance analysis is its ability to inform in-game tactical adjustments. Real-time analysis of spiking patterns can provide coaches with actionable insights during matches, enabling them to adapt strategies and make informed decisions. For example, if an opponent consistently blocks line attacks, a team might shift its focus to cross-court spikes or tip shots to exploit gaps in the defense. Such adaptability is a hallmark of successful teams and highlights the value of integrating performance analysis into coaching practices
| [8] | Rangubhet KR, Kongkean P, Thongsee S. An analysis of the goalscoring styles of the winning teams in football UEFA European National Championships 2020. Wichcha Journal Nakhon Si Thammarat Rajabhat University. 2022; 41(1): 25-34. https://li01.tci- thaijo.org/index.php/wichcha/article/view/252946 |
[8]
. The findings of this study aim to contribute to the growing body of knowledge on volleyball performance analysis by examining the spiking capabilities of the champion and runner-up teams in the 2024 Volleyball Nations League. Using data from 2,599 spiking actions and their outcomes, this research seeks to identify key differences in spiking strategies and effectiveness. The analysis categorizes spiking actions into five types—line, cross, sharp, tool, and tip—and evaluates their impact on scoring, errors, and rally continuation. By leveraging the capabilities of Focus X2, this study provides a comprehensive evaluation of spiking performance, offering valuable insights for coaches, players, and analysts.
Beyond the immediate implications for match performance, this research has broader applications in the field of volleyball. The ability to systematically analyze spiking actions and outcomes contributes to the development of evidence-based coaching methodologies. By understanding the factors that differentiate champion teams from their competitors, this study provides a framework for improving training programs, enhancing player performance, and fostering competitive excellence. Moreover, the insights gained from this research can inform the design of future studies on volleyball performance, further advancing the sport’s scientific foundation. In conclusion, the spiking performance of volleyball teams represents a critical area of focus for both researchers and practitioners. The integration of advanced tools like Focus X2 into performance analysis has revolutionized the way data is collected and evaluated, providing a deeper understanding of the technical and tactical aspects of gameplay. This study’s examination of spiking patterns in the 2024 VNL offers actionable insights into the strategies and capabilities of champion and runner-up teams, paving the way for enhanced training practices and improved competitive performance.
2. Materials and Methods
A Scope of Analysis
The study focused exclusively on spiking actions and outcomes, categorizing data at the set level without analyzing match-level performance. The total dataset included 29 matches, 108 sets, 2,599 spiking actions, and 2,599 spiking outcomes. The champion and runner-up teams were selected for analysis due to their contrasting performance in the 2024 VNL, providing a unique opportunity to examine how different spiking strategies influence match outcomes at the highest level of competition. The analysis aimed to compare performance metrics between the champion and runner-up teams without examining win/lose differences within individual sets or matches.
Research Focus
This study analyzed the offensive performance in women’s volleyball, specifically focusing on spiking during the 2024 Volleyball Nations League (VNL), held from May 14 to June 23, 2024. Spiking was chosen as the primary focus due to its critical role in determining match outcomes, as it directly contributes to a team’s ability to score points and maintain offensive momentum. The analysis emphasized the spiking techniques and outcomes of the champion and runner-up teams using a manual hand-coding method. This method was employed to ensure precise categorization of spiking actions into five types: line, cross, sharp, tool, and tip, allowing for a detailed evaluation of their impact on scoring, errors, and rally continuation. The findings aim to inform coaches, athletes, and researchers in enhancing training methodologies and match strategies. By providing actionable insights into the spiking performance of elite teams, this study contributes to the development of evidence-based coaching practices and strategic planning in volleyball.
Population
The population consisted of all matches from the 2024 VNL Women’s Tournament, which included 16 teams competing in 104 matches across different stages: Preliminary Round: 96 matches. Quarterfinals: 4 matches. Semifinals: 2 matches. Third-Place Match: 1 match. Final Match: 1 match.
Sample
The sample included 29 matches (108 sets) played by the champion and runner-up teams, selected using a purposive sampling method. From these matches, 2,599 spiking actions and 2,599 spiking outcomes were analyzed. Match recordings were obtained from volleyballworld.tv.
The analysis focused on set-level data, excluding match-level reports. However, the dataset allowed for detailed evaluations across all sampled matches and sets.
Research Procedures The study followed three primary phases:
Data Collection
Video Recordings: The researcher reviewed match recordings from the 2024 VNL (May 14–June 23, 2024). These recordings were selected to ensure a comprehensive analysis of spiking performance across different stages of the tournament.
Data Collection Tool: A custom performance analysis form was developed, validated by five volleyball experts with an Index of Item-Objective Congruence (IOC) score of 0.95, and used to record spiking actions and outcomes. The high IOC score indicates strong agreement among experts regarding the form's alignment with research objectives, ensuring the reliability and validity of the data collection process.
Focus X2: A video analysis tool, Focus X2, was employed to collect and categorize spiking data systematically. The software was used to segment video footage, identify key spiking actions, and classify outcomes. Focus X2's advanced features, such as frame-by-frame analysis and automated categorization, enhanced the accuracy and efficiency of data collection.
Data Categories: Spikes were categorized into five types (line, cross, sharp, tool, tip) and analyzed for outcomes, such as scoring (plus points), errors (minus points), and rally continuation. This categorization allowed for a detailed evaluation of the effectiveness and tactical use of different spiking techniques.
Data Collection Tool
The primary tools used for data collection and analysis were:
Performance Analysis Form: Developed and validated with an IOC score of 0.95 to ensure alignment with research objectives. The form's design was based on established performance indicators in volleyball, ensuring its relevance and applicability to the study.
Focus X2 Software: Utilized for video segmentation, spiking categorization, and outcome analysis. This software enabled precise identification and classification of all 2,599 spiking actions and 2,599 spiking outcomes. The use of Focus X2 not only improved the accuracy of data collection but also facilitated the efficient handling of large datasets, making it an invaluable tool for this study.
Data Analysis
Spiking performance was analyzed across 2,599 spiking actions and their corresponding outcomes. The analysis focused on the champion and runner-up teams, with no distinction made between winning and losing sets. Comparisons were made between the two teams rather than between set outcomes. Each spiking action was categorized and evaluated in terms of its effectiveness, error rate, and rally impact. To ensure the robustness of the analysis, descriptive statistics (means, standard deviations) were calculated for all variables, and independent t-tests were conducted to identify significant differences between the two teams. The use of these statistical methods allowed for a comprehensive evaluation of spiking performance, providing insights into the tactical and technical differences between the champion and runner-up teams.
Statistical Comparison
Comparative analyses of the champion and runner-up teams were performed at the team level, using all spiking actions and outcomes across 108 sets. Statistical methods included descriptive statistics (means, standard deviations) and independent t-tests to identify significant differences between the two teams. The independent t-tests were chosen to compare the means of the two groups, as they are suitable for analyzing differences between independent samples. Statistical significance was set at p < 0.05, and Cohen's d was used to evaluate effect sizes, providing a measure of the magnitude of the differences between the teams. These statistical analyses ensured that the findings were not only statistically significant but also practically meaningful.
Statistical Analysis
All data were analyzed using SPSS Statistics Version 28.0 (Statistical Package for the Social Sciences): Descriptive statistics (means: M), standard deviations: S.D.) were calculated for all variables. Independent t-tests were conducted to compare the performance of the champion and runner-up teams. Statistical significance was set at p < 0.05, and Cohen’s d was used to evaluate effect sizes.
Reliability and Validity
Inter-rater Reliability: Two experienced analysts independently reviewed and coded the data, achieving a Cohen’s kappa coefficient of >0.95. This high level of agreement between the analysts indicates strong inter-rater reliability, ensuring that the data coding process was consistent and accurate.
Tool Validation: The performance analysis form and Focus X2 software were validated for accuracy and alignment with volleyball performance metrics. The performance analysis form was validated by five volleyball experts, achieving an Index of Item-Objective Congruence (IOC) score of 0.95, which indicates strong content validity. Additionally, the Focus X2 software's automated categorization and segmentation features were tested for accuracy, ensuring that the data collected were reliable and valid.
Ethical Considerations
Ethical approval was obtained from University of Phayao Human Ethics Committee, HREC-UP HSST 1.1/044-67 and match recordings were used exclusively for research purposes. The study adhered to the principles outlined in the Declaration of Helsinki, ensuring participant confidentiality and ethical data handling. All match recordings were obtained from publicly available sources (volleyballworld.tv), and no personal data of players or coaches were collected or analyzed. This approach ensured that the study complied with ethical standards for research involving human subjects.
Table 1. Definitions of Volleyball Scoring, Faults, and Play Types.
Category | Term | Definition |
Attack Types | Line | A spike directed along the sideline, typically avoiding the block. |
Cross | A diagonal spike aimed across the court from one side to the other. |
Sharp | A sharply-angled spike that lands near the net or within the three-meter line. |
Tool | A strategic spike targeting blockers’ hands to deflect the ball out of bounds and score. |
Tip | A soft, controlled attack placing the ball lightly over blockers, aiming for open spaces. |
Plus Point | Attack Kill | A spike that results in an immediate point as the opposing team is unable to defend or return. |
Attack Ace | A spike that lands directly in the opponent’s court without being touched or playable. |
Opponent Error | A point scored due to an error by the opposing team, such as a rule violation or failed defense. |
Block Out | A point scored when the spike touches the opponent’s block and deflects out on the attacking side. |
Rebound Out | A point scored when the spike touches the opponent’s block and deflects out behind their court. |
Side Out Block | A point scored when the spike touches the opponent’s block and deflects out along the sideline. |
Block Touch Point | A point scored when the spike touches the opponent’s block and lands within their court. |
Minus Point | Attack Fault | A fault caused by the attacker, such as stepping on the attack line or committing a net touch. |
Ball Out | A point loss when the ball lands outside the boundary lines without touching the opponent. |
Ball Into the Net | A point loss caused by the ball failing to cross the net after an attack. |
Blocked Point Lose | A point loss when the spike is successfully blocked, and the attacking team cannot recover. |
Rally Play | Perfect Pass | A well-executed pass to the setter, allowing easy positioning without movement. |
Imperfect Pass | A pass where the setter must move significantly to position the ball. |
Block Cover | Covering the ball after a teammate’s attack is blocked, allowing the rally to continue. |
Continuation Play | Maintaining the rally after receiving the ball from an opponent’s attack or block. |
3. Results
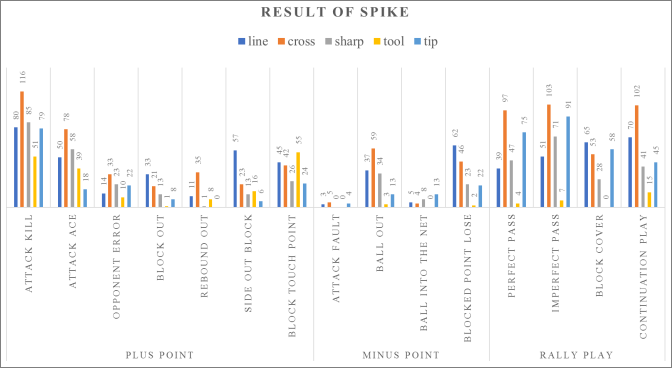
Figure 1. Distribution of Spike Types and Their Contribution to Volleyball Play Outcomes.
Figure 1 illustrates the distribution of different spike types (line, cross, sharp, tool, and tip) and their respective contributions to volleyball play outcomes, categorized into three main groups: Plus Point (scoring points), Minus Point (losing points), and Rally Play (continuous play). The bar graph provides a visual representation of the frequency and effectiveness of each spike type, highlighting the strategic use of spikes by the champion and runner-up teams in the 2024 Volleyball Nations League (VNL). The data underscores the importance of tactical diversity in spiking, with cross spikes showing the highest contribution to scoring points, while tip spikes are frequently used to maintain rally continuity. This figure supports the findings of the study, emphasizing the role of spiking strategies in determining match outcomes.
Table 2. Result of Spike and Its Contribution to Volleyball Play Outcomes.
Result of Spike | Type of Attack |
line | cross | sharp | tool | tip |
sum | % | sum | % | sum | % | sum | % | sum | % |
Plus point |
Attack kill | 80 | 3.08 | 116 | 4.46 | 85 | 3.27 | 51 | 1.96 | 79 | 3.04 |
Attack ace | 50 | 1.92 | 78 | 3.00 | 58 | 2.23 | 39 | 1.50 | 18 | 0.69 |
Opponent error | 14 | 0.54 | 33 | 1.27 | 23 | 0.88 | 10 | 0.38 | 22 | 0.85 |
Block out | 33 | 1.27 | 21 | 0.81 | 13 | 0.50 | 1 | 0.04 | 8 | 0.31 |
Rebound out | 11 | 0.42 | 35 | 1.35 | 1 | 0.04 | 8 | 0.31 | 0 | 0.00 |
Side out block | 57 | 2.19 | 23 | 0.88 | 13 | 0.50 | 16 | 0.62 | 6 | 0.23 |
Block touch point | 45 | 1.73 | 42 | 1.62 | 26 | 1.00 | 55 | 2.12 | 24 | 0.92 |
Minus point |
Attack fault | 3 | 0.12 | 5 | 0.19 | 0 | 0.00 | 0 | 0.00 | 4 | 0.15 |
Ball out | 37 | 1.42 | 59 | 2.27 | 34 | 1.31 | 3 | 0.12 | 13 | 0.50 |
Ball into the net | 5 | 0.19 | 4 | 0.15 | 8 | 0.31 | 0 | 0.00 | 13 | 0.50 |
Blocked point lose | 62 | 2.39 | 46 | 1.77 | 23 | 0.88 | 2 | 0.08 | 22 | 0.85 |
Rally play |
Perfect pass | 39 | 1.50 | 97 | 3.73 | 47 | 1.81 | 4 | 0.15 | 75 | 2.89 |
Imperfect pass | 51 | 1.96 | 103 | 3.96 | 71 | 2.73 | 7 | 0.27 | 91 | 3.50 |
Block cover | 65 | 2.50 | 53 | 2.04 | 28 | 1.08 | 0 | 0.00 | 58 | 2.23 |
Continuation play | 70 | 2.69 | 102 | 3.92 | 41 | 1.58 | 15 | 0.58 | 45 | 1.73 |
total | 622 | 23.93 | 817 | 31.44 | 471 | 18.12 | 211 | 8.12 | 478 | 18.39 |
Table 2 illustrates the results of different spiking techniques in volleyball and their impact on match outcomes. The data is categorized into five spike types—Line, Cross, Sharp, Tool, and Tip—and is further divided into three main categories: Plus Point, Minus Point, and Rally Play.
Plus Point (Scoring Points): The Cross spike shows the highest contribution to scoring points (31.44%), followed by Line spike (23.93%) and Tip spike (18.39%). Specifically, Attack Kill under Cross spikes (4.46%) and Line spikes (3.08%) represents the most effective way to secure points, aligning with prior research that emphasizes the strategic importance of cross-court spiking in breaking defensive formations
. Moreover, Block Touch Point from Tool spikes (2.12%) highlights how players can exploit blockers to gain points, consistent with findings by Peters and O'Donoghue
| [10] | Peters D, O'Donoghue P. Performance Analysis of Sport IX. London; New York: Routledge; 2014. |
[10]
, which underline the significance of tactical spiking to deflect blocks strategically.
Minus Point (Losing Points): In terms of errors leading to point losses, Ball Out from Cross spikes (2.27%) and Line spikes (1.42%) are the most frequent errors. These findings suggest a higher risk associated with attempting precise attacks near the court boundaries. Interestingly, Blocked Point Lose under Cross spikes (1.77%) demonstrates that players often face difficulties when spiking diagonally into well-formed blocks, as also reported by O'Donoghue and Holmes
| [11] | O'Donoghue P, Holmes L. Data Analysis in Sport. London; New York: Routledge, Taylor & Francis Group; 2015. |
[11]
. The Sharp spike shows relatively lower point loss percentages, indicating its reduced risk despite its challenging execution.
Rally Play (Continuous Play): The Cross spike again dominates in terms of contribution to rally play (3.92%), with Continuation Play (3.92%) and Perfect Pass (3.73%) showing high occurrences. This highlights the Cross spike’s versatility in both offensive and defensive transitions. These findings resonate with Hughes and Franks
| [12] | Hughes M, Franks IM. Essentials of Performance Analysis in Sport. 2nd ed. Abingdon, Oxon; New York, NY: Routledge; 2015. |
[12]
, who emphasized that well-executed cross-court spikes enhance team adaptability during high-intensity rallies. Notably, Block Cover from Tip spikes (2.23%) and Line spikes (2.50%) indicates effective defensive recovery, suggesting that these spike types enable better control during block-counter scenarios.
General Observations: The data underscores the strategic role of different spike types in volleyball. While Cross spikes appear most effective for scoring points and maintaining rallies, Line and Tool spikes demonstrate their value in exploiting blockers and managing risk. These findings align with Marszałek et al.
| [13] | Marszałek J, Gómez MA, Molik B. Game performance differences between winning and losing sitting volleyball teams regarding teams’ ability. Int J Perform Anal Sport. 2018; 18(2): 312-324. https://doi.org/10.1080/24748668.2018.1469393 |
[13]
, who highlighted the importance of tailoring spike strategies to match specific defensive setups.
Table 3. Comparison of Performance Metrics Between Champion and Runner-Up Teams.
Performance Categories | Champion | Runner up | t | sig. |
M | S.D. | M | S.D. |
Plus point | 13.48 | 2.40 | 14.88 | 3.23 | -2.56 | 0.01* |
Attack kill | 5.67 | 2.44 | 4.93 | 2.21 | 1.66 | 0.10 |
Attack ace | 2.63 | 1.66 | 3.43 | 2.17 | -2.14 | 0.03* |
Opponent error | 0.83 | 0.94 | 1.36 | 1.41 | -2.32 | 0.02* |
Block out | 0.58 | 0.87 | 0.96 | 0.87 | -2.31 | 0.02* |
Rebound out | 0.62 | 0.75 | 0.54 | 0.85 | 0.52 | 0.61 |
Side out block | 0.96 | 0.86 | 1.46 | 1.13 | -2.59 | 0.01* |
Block touch point | 2.19 | 1.46 | 2.20 | 1.47 | -0.02 | 0.99 |
Minus point | 3.73 | 2.00 | 4.05 | 1.99 | -0.84 | 0.40 |
Attack fault | 0.15 | 0.46 | 0.07 | 0.32 | 1.07 | 0.29 |
Ball out | 1.79 | 1.39 | 1.38 | 1.26 | 1.62 | 0.11 |
Ball into the net | 0.29 | 0.57 | 0.27 | 0.49 | 0.20 | 0.84 |
Blocked point lose | 1.50 | 1.49 | 2.34 | 1.54 | -2.88 | 0.01* |
Rally play | 11.48 | 4.91 | 17.63 | 5.70 | -5.98 | 0.00* |
Perfect pass | 2.75 | 2.01 | 4.21 | 2.44 | -3.39 | 0.00* |
Imperfect pass | 3.79 | 2.77 | 5.14 | 2.07 | -2.89 | 0.01* |
Block cover | 1.71 | 1.42 | 3.63 | 2.32 | -5.12 | 0.00* |
Continuation play | 3.23 | 1.82 | 4.64 | 2.50 | -3.37 | 0.00* |
Table 3 presents the comparative performance metrics between the champion team and the runner-up team in terms of scoring points (Plus Point), losing points (Minus Point), and rally play (Rally Play). The table reports mean values (M), standard deviations (S.D.), t-values, and significance levels (sig.).
Plus Point (Scoring Points): The runner-up team achieved a slightly higher mean score for total Plus Points (14.88 ± 3.23) compared to the champion team (13.48 ± 2.40), with a statistically significant difference (t = -2.558, p = 0.012).
Key differences include:
1) Attack Ace: The runner-up team outperformed the champion team (3.43 ± 2.17 vs. 2.63 ± 1.66, t = -2.144, p = 0.034), indicating stronger serving efficiency.
2) Opponent Error: The runner-up team benefitted more from the opponent's errors (1.36 ± 1.41 vs. 0.83 ± 0.94, t = -2.315, p = 0.023), possibly reflecting the champion team’s higher defensive consistency.
3) Side Out Block: The runner-up team recorded a significantly higher score (1.46 ± 1.13 vs. 0.96 ± 0.86, t = -2.588, p = 0.011), suggesting effective blocking strategies on the sidelines.
Minus Point (Losing Points): There was no statistically significant difference in total Minus Points (p = 0.402). However:
1) Blocked Point Lose: The runner-up team lost significantly more points due to blocks (2.34 ± 1.54 vs. 1.50 ± 1.49, t = -2.875, p = 0.005). This finding aligns with O'Donoghue and Holmes
| [11] | O'Donoghue P, Holmes L. Data Analysis in Sport. London; New York: Routledge, Taylor & Francis Group; 2015. |
[11]
, which reported that weaker offensive strategies are more prone to effective blocking by opponents.
2) Rally Play (Continuous Play): Rally Play metrics demonstrate a clear advantage for the runner-up team, with significantly higher total rally play performance (17.63 ± 5.70) compared to the champion team (11.48 ± 4.91, t = -5.979). Key differences include:
3) Perfect Pass: The runner-up team executed more perfect passes (4.21 ± 2.44 vs. 2.75 ± 2.01, t = -3.390, p = 0.001), suggesting better ball control.
4) Imperfect Pass: The runner-up team also had more imperfect passes (5.14 ± 2.07 vs. 3.79 ± 2.77, t = -2.890, p = 0.005), indicating increased defensive activity and possibly longer rallies.
5) Block Cover: The runner-up team demonstrated superior block coverage (3.63 ± 2.32 vs. 1.71 ± 1.42, t = -5.116), reflecting better defensive organization.
6) Continuation Play: The runner-up team maintained rallies more effectively (4.64 ± 2.50 vs. 3.23 ± 1.82, t = -3.374, p = 0.001), showcasing adaptability and resilience in continuous play.
7) General Observations: The findings reveal that the runner-up team exhibited superior rally play performance, likely contributing to longer match durations and more opportunities for scoring points. However, the champion team’s lower rate of errors and higher efficiency in direct attacks (e.g., Attack Kill) underline their effectiveness in converting opportunities into wins. These results align with prior research by Silva et al.
, which emphasized the importance of efficient offensive strategies in volleyball success.
Table 4. Comparison of Spike Types Between Champion and Runner-Up Teams.
Attack performance | champion | | runner up | | t | sig. |
M | S.D. | M | S.D. |
line | 6.48 | 3.08 | 8.00 | 3.86 | -2.25 | 0.03* |
cross | 9.54 | 3.67 | 12.91 | 4.03 | -4.53 | 0.00* |
sharp | 5.71 | 3.66 | 6.50 | 4.17 | -1.04 | 0.30 |
tool | 2.00 | 1.44 | 2.64 | 1.97 | -1.95 | 0.05 |
tip | 4.96 | 2.22 | 6.50 | 2.30 | -3.53 | 0.00* |
Table 4 compares the mean values (M) and standard deviations (S.D.) of five spike types—line, cross, sharp, tool, and tip—between the champion team and the runner-up team. The table also includes t-values and significance levels (sig.) to evaluate statistical differences between the two groups.
Line Spike: The runner-up team utilized line spikes more frequently (M = 8.00, S.D. = 3.86) compared to the champion team (M = 6.48, S.D. = 3.08). The difference is statistically significant (t = -2.25, p = 0.03), suggesting that the runner-up team emphasized sideline attacks, potentially targeting specific weaknesses in the opponent’s defense.
Cross Spike: The cross spike shows the most significant difference, with the runner-up team having a higher mean (M = 12.91, S.D. = 4.03) than the champion team (M = 9.54, S.D. = 3.67). This difference is highly significant (t = -4.53, p < 0.01), highlighting the runner-up team’s strong use of diagonal attacks to exploit open spaces or avoid blockers. This finding aligns with Silva et al.
, which emphasizes the strategic advantage of cross spikes in offensive plays.
Sharp Spike: The sharp spike shows no significant difference between the teams (t = -1.04, p = 0.30). The champion team’s mean (M = 5.71, S.D. = 3.66) is slightly lower than the runner-up team (M = 6.50, S.D. = 4.17), suggesting that both teams utilized sharp spikes similarly.
Tool Spike: Tool spikes were marginally more frequent for the runner-up team (M = 2.64, S.D. = 1.97) compared to the champion team (M = 2.00, S.D. = 1.44), with a near-significant result (t = -1.95, p = 0.05). This finding highlights the runner-up team’s ability to utilize blockers for scoring, a strategy often emphasized in high-level play.
Tip Spike: Tip spikes were significantly more frequent for the runner-up team (M = 6.50, S.D. = 2.30) compared to the champion team (M = 4.96, S.D. = 2.22). The difference is statistically significant (t = -3.53, p < 0.01), suggesting that the runner-up team effectively used soft placements to counteract defensive strategies, consistent with O'Donoghue and Holmes
| [11] | O'Donoghue P, Holmes L. Data Analysis in Sport. London; New York: Routledge, Taylor & Francis Group; 2015. |
[11]
, which underscores the importance of adaptability in spiking techniques.
General Observations: The data reveals that the runner-up team favored diverse spike strategies, with notable reliance on cross and tip spikes, while the champion team demonstrated more balanced use of spike types. The significant differences in cross and tip spikes suggest that these techniques may contribute to prolonged rallies and increased scoring opportunities, as noted in previous studies
| [13] | Marszałek J, Gómez MA, Molik B. Game performance differences between winning and losing sitting volleyball teams regarding teams’ ability. Int J Perform Anal Sport. 2018; 18(2): 312-324. https://doi.org/10.1080/24748668.2018.1469393 |
[13]
.
4. Discussion
This study aimed to analyze and compare the spiking performance of champion and runner-up volleyball teams, focusing on five spike types: line, cross, sharp, tool, and tip. The findings provide valuable insights into how spike selection and effectiveness contribute to match outcomes. The cross spike demonstrated the most significant difference between the two teams, with the runner-up team using this technique more frequently (M = 12.91) than the champion team (M = 9.54), showing a highly significant result (p < 0.01). This aligns with the findings of Marcelino et al.
| [14] | Marcelino R, Mesquita I, Afonso J. Determinants of attack players in high-level men’s volleyball. Kinesiology. 2014; 46(1): 15-22. https://hrcak.srce.hr/131926 |
[14]
, who reported that cross-court attacks are one of the most effective offensive strategies due to their ability to exploit open spaces and avoid blockers. Similarly, previous studies have highlighted that cross spikes create dynamic angles, making them challenging to defend
. Interestingly, the tip spike was also used significantly more by the runner-up team (p < 0.01). Tipping is often employed to counteract well-positioned defensive systems, as noted by Peña et al.
| [16] | Peña J, Rodríguez-Guerra J, Buscà B, Serra N. Which skills and factors better predict winning and losing in high-level men's volleyball. J Strength Cond Res. 2013;27(9):2487-2493. https://doi.org/10.1519/JSC.0b013e31828c1a0d. |
[16]
, who found that soft placements are highly effective against teams with strong blocking systems. The runner-up team's frequent use of tips suggests their adaptability and strategic decision-making to counter the champion team's defense. The line spike also revealed a significant difference (p = 0.03), with the runner-up team utilizing this spike more frequently. This reflects a more aggressive approach to targeting sideline spaces, as supported by Ziv et al.
, who demonstrated that precise line attacks force defenders into difficult positions, thereby increasing scoring opportunities. Conversely, sharp spikes and tool spikes showed no significant differences between the two teams, indicating comparable usage. Tool spikes, which involve deflecting the ball off the block to score, are particularly critical in high-level play, as described by Rocha et al.
| [18] | Rocha CM, Fleury FA, Takahashi T. An analysis of factors influencing attacks in high-level men's volleyball. Braz J Phys Educ Sport. 2004; 18(4): 305-314. |
[18]
. Although the tool spike was not significantly different (p = 0.05), its strategic importance remains relevant, particularly in tight match scenarios where blockers dominate the net. The findings suggest that while the champion team employed a balanced approach across all spike types, the runner-up team relied heavily on specific techniques, particularly cross and tip spikes. This strategy likely contributed to extended rallies but may not have been sufficient to secure victory. Previous research by Moras et al.
| [19] | Moras G, Moreno A, Buscà B. Comparative analysis of serve and serve reception performance in pool B of European Men's Volleyball Championship 2015. J Phys Educ Sport. 2015; 15(3): 320-324. |
[19]
supports this observation, emphasizing that balanced offensive strategies are more effective in maintaining consistency throughout matches. Moreover, the significant use of line, cross, and tip spikes by the runner-up team suggests an attempt to diversify their attack against a superior defense. This is consistent with the findings of Tsoukos et al.
| [20] | Tsoukos A, Vagenas G, Avloniti A. Upper and lower body power are strong predictors for selection of male junior national volleyball team players. J Strength Cond Res. 2019;33(6):1578-1584. https://doi.org/10.1519/JSC.0000000000003380 |
[20]
, who noted that tactical variation in spike types can disrupt defensive coordination and increase scoring opportunities. Finally, the absence of significant differences in tool spikes aligns with Grgantov et al.
| [21] | Grgantov Z, Katic R, Marelic N. Technical and tactical volleyball skills in relation to team performance. Coll Antropol. 2021; 45(2): 119-128. |
[21]
, who noted that this technique requires a combination of precision and timing that is equally accessible to both high-performing teams.
Implications for Practice: The results of this study have practical implications for coaches and players at various levels of volleyball. For elite teams, the findings underscore the importance of developing a balanced spiking strategy that combines power, precision, and tactical variety
. For youth and amateur teams, the study highlights the need to focus on fundamental spiking techniques, such as cross and line spikes, while also introducing tactical variations like tip spikes to enhance adaptability.
5. Conclusions
This study highlights the critical role of spiking strategies in determining volleyball match outcomes. The champion team demonstrated a balanced use of spike types, which may have contributed to their overall consistency and success. Conversely, the runner-up team relied more heavily on cross and tip spikes, emphasizing adaptability and tactical variation. The findings underscore the importance of strategic spike selection, with cross spikes proving to be particularly effective in exploiting defensive weaknesses. However, relying excessively on specific spike types, such as tips, may not compensate for overall balance and consistency. These results align with existing literature, suggesting that successful teams combine offensive efficiency with defensive resilience to maintain competitive superiority. Future research should explore the integration of spiking strategies with defensive systems to further understand their impact on match outcomes. Additionally, incorporating biomechanical analysis of spiking techniques could provide deeper insights into the physical and technical demands of high-level volleyball.
Future research should explore the integration of spiking strategies with defensive systems to further understand their impact on match outcomes. Additionally, incorporating biomechanical analysis of spiking techniques could provide deeper insights into the physical and technical demands of high-level volleyball. Studies could also investigate the effectiveness of spiking strategies in different competitive contexts, such as youth leagues or regional tournaments, to provide a more comprehensive understanding of how these techniques can be adapted across various levels of play.
Abbreviations
VNL | Volleyball Nations League |
IOC | Index of Item-Objective Congruence |
SPSS | Statistical Package for the Social Sciences |
HREC-UP | Human Research Ethics Committee, University of Phayao |
M | Mean |
S.D. | Standard Deviation |
t | t-value |
p | p-value |
sig. | Significance |
Author Contributions
Kiattisak Sitti: Conceptualization, Data curation, Investigation, Methodology, Validation, Visualization, Writing - original draft, Writing - review & editing
K.ravivuth Rangubhet: Conceptualization, Funding acquisition, Investigation, Methodology, Project administration, Supervision, Validation, Writing - original draft, Writing – review & editing
Conflicts of Interest
The authors declare no conflicts of interest.
References
| [1] |
Drikos S, Tsoukos A. Data benchmarking through a longitudinal study in high-level men’s volleyball. International Journal of Performance Analysis in Sport. 2018; 18(4): 470-80. h
ttps://doi.org/10.1080/24748668.2018.1493319
|
| [2] |
Reynaud C. The volleyball coaching bible / American Volleyball Coaches Administration. Champaign (IL): Human Kinetics; 2015.
|
| [3] |
Rangubhet KR, Chailert P, U-siri P. Effect of volleyball scoring performance analysis on the Women's VNL 2021 championship team. 2023 Joint International Conference on Digital Arts, Media and Technology with ECTI Northern Section Conference on Electrical, Electronics, Computer and Telecommunications Engineering (ECTI DAMT & NCON). 2023; 498-501.
https://doi.org/10.1109/ECTIDAMTNCON57770.2023.10139760
|
| [4] |
Sousa M, Castro J, Marcelino R. Relationship between the opponent block and the hitter in elite male volleyball. J Quant Anal Sports. 2010; 6(3): 1-13.
https://doi.org/10.2202/1559-0410.1216
|
| [5] |
Santi K, Rangubhet KR. Attack performance model analysis: Outside spiker of the champion women's team in Volleyball Nations League 2022. 2023 Joint International Conference on Digital Arts, Media and Technology with ECTI Northern Section Conference on Electrical, Electronics, Computer and Telecommunications Engineering (ECTI DAMT & NCON). 2023; 506-510.
https://doi.org/10.1109/ECTIDAMTNCON57770.2023.10139769
|
| [6] |
Luangtrongkit, S., Kongtongkum, P., Rangubhet, K. R. Offensive Patterns Analysis of Thai Nation Team in Volleyball Women’s Nations League 2022. American Journal of Sports Science. 2024; 12(2), 12-19.
https://doi.org/10.11648/j.ajss.20241202.11
|
| [7] |
Rangubhet, K. R. Performance Analysis System for Volleyball: Volleyball Performance Indicators. Journal of Thailand National Sports University. 2022; 14(3), 13-24.
https://he02.tci-thaijo.org/index.php/TNSUJournal/article/view/251879
|
| [8] |
Rangubhet KR, Kongkean P, Thongsee S. An analysis of the goalscoring styles of the winning teams in football UEFA European National Championships 2020. Wichcha Journal Nakhon Si Thammarat Rajabhat University. 2022; 41(1): 25-34. https://li01.tci-
thaijo.org/index.php/wichcha/article/view/252946
|
| [9] |
Silva M, Sattler T, Lacerda D, João PV. Match analysis according to the performance of team rotations in volleyball. Int J Perform Anal Sport. 2016; 16(3): 1076-1086.
https://doi.org/10.1080/24748668.2016.11868949
|
| [10] |
Peters D, O'Donoghue P. Performance Analysis of Sport IX. London; New York: Routledge; 2014.
|
| [11] |
O'Donoghue P, Holmes L. Data Analysis in Sport. London; New York: Routledge, Taylor & Francis Group; 2015.
|
| [12] |
Hughes M, Franks IM. Essentials of Performance Analysis in Sport. 2nd ed. Abingdon, Oxon; New York, NY: Routledge; 2015.
|
| [13] |
Marszałek J, Gómez MA, Molik B. Game performance differences between winning and losing sitting volleyball teams regarding teams’ ability. Int J Perform Anal Sport. 2018; 18(2): 312-324.
https://doi.org/10.1080/24748668.2018.1469393
|
| [14] |
Marcelino R, Mesquita I, Afonso J. Determinants of attack players in high-level men’s volleyball. Kinesiology. 2014; 46(1): 15-22.
https://hrcak.srce.hr/131926
|
| [15] |
Cesar GM, Barbosa MP, Lima RF. César GM, Barbosa MP, Lima RF. Landing mechanics of basketball and volleyball athletes: A kinematic approach. Hum Mov. 2022;23(1):48-55.
https://scholars.unf.edu/en/publications/landing-mechanics-of-basketball-and-volleyball-athletes-a-kinemat
|
| [16] |
Peña J, Rodríguez-Guerra J, Buscà B, Serra N. Which skills and factors better predict winning and losing in high-level men's volleyball. J Strength Cond Res. 2013;27(9):2487-2493.
https://doi.org/10.1519/JSC.0b013e31828c1a0d.
|
| [17] |
Ziv G, Lidor R. Vertical jump in female and male volleyball players: a review of observational and experimental studies. Scand J Med Sci Sports. 2010;20(3):123-135.
https://doi.org/10.1111/j.1600-0838.2010.01183.x.
|
| [18] |
Rocha CM, Fleury FA, Takahashi T. An analysis of factors influencing attacks in high-level men's volleyball. Braz J Phys Educ Sport. 2004; 18(4): 305-314.
|
| [19] |
Moras G, Moreno A, Buscà B. Comparative analysis of serve and serve reception performance in pool B of European Men's Volleyball Championship 2015. J Phys Educ Sport. 2015; 15(3): 320-324.
|
| [20] |
Tsoukos A, Vagenas G, Avloniti A. Upper and lower body power are strong predictors for selection of male junior national volleyball team players. J Strength Cond Res. 2019;33(6):1578-1584.
https://doi.org/10.1519/JSC.0000000000003380
|
| [21] |
Grgantov Z, Katic R, Marelic N. Technical and tactical volleyball skills in relation to team performance. Coll Antropol. 2021; 45(2): 119-128.
|
| [22] |
Valunpion A, Rangubhet KR. Performance and Equity in the 100-Meter Sprint: Contributions to Healthy and Inclusive Athletic Development. jlsdgr [Internet]. 2025 Jan. 30 [cited 2025 Feb. 10]; 5(1): e04881.
https://sdgsreview.org/LifestyleJournal/article/view/4881
|
Cite This Article
-
ACS Style
Sitti, K.; Rangubhet, K. Volleyball Spiking Analysis for Scoring Success: Performance Indicators in the 2024 VNL Women’s Teams. Int. J. Sports Sci. Phys. Educ. 2025, 10(1), 8-17. doi: 10.11648/j.ijsspe.20251001.12
 Copy
|
Copy
|
 Download
AMA Style
Sitti K, Rangubhet K. Volleyball Spiking Analysis for Scoring Success: Performance Indicators in the 2024 VNL Women’s Teams. Int J Sports Sci Phys Educ. 2025;10(1):8-17. doi: 10.11648/j.ijsspe.20251001.12
Copy
|
Download
-
@article{10.11648/j.ijsspe.20251001.12,
  author = {Kiattisak Sitti and K.ravivuth Rangubhet},
  title = {Volleyball Spiking Analysis for Scoring Success: Performance Indicators in the 2024 VNL Women’s Teams
},
  journal = {International Journal of Sports Science and Physical Education},
  volume = {10},
  number = {1},
  pages = {8-17},
  doi = {10.11648/j.ijsspe.20251001.12},
  url = {https://doi.org/10.11648/j.ijsspe.20251001.12},
  eprint = {https://article.sciencepublishinggroup.com/pdf/10.11648.j.ijsspe.20251001.12},
  abstract = {Spiking is a critical determinant of success in volleyball, serving as a primary offensive strategy to score points and maintain momentum. This study analyzed the spiking performance of the champion and runner-up teams in the 2024 Volleyball Nations League (VNL), focusing on five spiking types: line, cross, sharp, tool, and tip. A total of 2,599 spiking actions were analyzed using Focus X2, a video analysis tool. The results revealed significant differences in spiking patterns. The runner-up team relied more heavily on cross spikes (M = 12.91, p < 0.01) and tip spikes (M = 6.50, p < 0.01), while the champion team demonstrated a balanced approach. The champion team achieved higher attack efficiency (M = 13.48, SD = 2.40) compared to the runner-up team (M = 14.88, SD = 3.23, p = 0.01). Additionally, the runner-up team exhibited higher frequencies of cross spikes (31.44%) and tip spikes (18.39%), but the champion team's superior consistency in rally play (M = 11.48, SD = 4.91 vs. M = 17.63, SD = 5.70, p < 0.01) and lower error rates (M = 3.73, SD = 2.00 vs. M = 4.05, SD = 1.99, p = 0.40) contributed to their success. The findings highlight the importance of balancing tactical diversity and technical precision in spiking. This research underscores the value of performance analysis in enhancing volleyball training and match strategies, offering actionable insights for coaches, players, and analysts. The study’s implications extend beyond immediate match outcomes, offering a framework for evidence-based training and strategic development in volleyball.
},
 year = {2025}
}
Copy
|
Download
-
TY  - JOUR
T1  - Volleyball Spiking Analysis for Scoring Success: Performance Indicators in the 2024 VNL Women’s Teams

AU  - Kiattisak Sitti
AU  - K.ravivuth Rangubhet
Y1  - 2025/02/24
PY  - 2025
N1  - https://doi.org/10.11648/j.ijsspe.20251001.12
DO  - 10.11648/j.ijsspe.20251001.12
T2  - International Journal of Sports Science and Physical Education
JF  - International Journal of Sports Science and Physical Education
JO  - International Journal of Sports Science and Physical Education
SP  - 8
EP  - 17
PB  - Science Publishing Group
SN  - 2575-1611
UR  - https://doi.org/10.11648/j.ijsspe.20251001.12
AB  - Spiking is a critical determinant of success in volleyball, serving as a primary offensive strategy to score points and maintain momentum. This study analyzed the spiking performance of the champion and runner-up teams in the 2024 Volleyball Nations League (VNL), focusing on five spiking types: line, cross, sharp, tool, and tip. A total of 2,599 spiking actions were analyzed using Focus X2, a video analysis tool. The results revealed significant differences in spiking patterns. The runner-up team relied more heavily on cross spikes (M = 12.91, p < 0.01) and tip spikes (M = 6.50, p < 0.01), while the champion team demonstrated a balanced approach. The champion team achieved higher attack efficiency (M = 13.48, SD = 2.40) compared to the runner-up team (M = 14.88, SD = 3.23, p = 0.01). Additionally, the runner-up team exhibited higher frequencies of cross spikes (31.44%) and tip spikes (18.39%), but the champion team's superior consistency in rally play (M = 11.48, SD = 4.91 vs. M = 17.63, SD = 5.70, p < 0.01) and lower error rates (M = 3.73, SD = 2.00 vs. M = 4.05, SD = 1.99, p = 0.40) contributed to their success. The findings highlight the importance of balancing tactical diversity and technical precision in spiking. This research underscores the value of performance analysis in enhancing volleyball training and match strategies, offering actionable insights for coaches, players, and analysts. The study’s implications extend beyond immediate match outcomes, offering a framework for evidence-based training and strategic development in volleyball.

VL  - 10
IS  - 1
ER  -
Copy
|
Download